


by Parvalbumin Interneurons in the Tail of the Striatum
Published on 2025/01/22 Research powered by Mightex’s Polygon1000 ![]()

Li, X., You, J., Pan, Y., Song, C., Li, H., Ji, X., & Liang, F., Effective Regulation of Auditory Processing by Parvalbumin Interneurons in the Tail of the Striatum. Journal of Neuroscience, 44(5) (2024).
![]()

One primary goal in neuroscience is to understand how cortical sensory structures in the brain convert sensations into perceptions. Oftentimes this is done by investigating individual regional patterns of connectivity within a structure. Sensory processing is achieved in the cortex through a combination of feedforward processing propagated by pyramidal neurons and lateral inhibition via interneurons. Information is passed from one layer of the cortex to the next and is refined at each level. Feedforward processing strengthens the signal of important information allowing it to move to the next layer while lateral inhibition deadens noisy information. Together, these two processes: feedforward processing and lateral inhibition, shape neural activity as it passes through the cortex, converting sensation into perception.
Researchers Xuan Li et al. at The Great Bay Area Center for Brain Research have been investigating the properties of auditory structures within the brains of mice to try and understand how specific cell types differ between them and how those cellular differences lead to functional differences between regions. The two primary regions of interest for investigating auditory processing are the auditory cortex (AC) and the tail of the striatum (TS). Each of these regions are composed of an array of neuron subtypes. The most common pyramidal cell type in these regions are pyramidal neurons called spiny projection neurons (SPNs); they drive the majority of synaptic output from these regions. The most common interneuron cell type in these regions are parvalbumin interneurons (PVs); they exert a powerful effect on auditory processing via feedforward inhibition on SPNs. Together these two cell types, SPNs and PVs, shape neural signals within the AC and TS to convert low level auditory sensations into behaviour driving perceptions.
In their paper Effective Regulation of Auditory Processing by Parvalbumin Interneurons in the Tail of the Striatum, Li et al. (2024) investigated the differences in connectivity between SPNs and PV interneurons within the TS and AC. One method they used to investigate PV interneuron activity in these two regions was Channelrhodopsin-2-Assisted Circuit Mapping (CRACM), a technique that allows researchers to dissect large complex neural circuits with optogenetics.To do this, cells of interest in a slice of neural tissue are infected with channelrhodopsin, an opsin that genetically modifies cells so that they depolarize when they are stimulated by blue light. Next, a second cell type of interest is patched so that the researchers can record the internal voltage of the cell. Finally, blue light is patterned on to the sample in a grid, stimulating one small section of tissue at a time. As the patterned light makes its way across the sample, the firing rate of the patched cell is recorded. Researchers then correlate the firing rate of the cell with the regions that are being optogenetically stimulated and create a heatmap of connectivity, allowing them to investigate the relationship between the patched cell and the spatial distribution of the optogenetically modified cells.
This technique, CRACM, was used by Li et al. to investigate how the spatial relationship between PV and SPNs differs across the auditory cortex and the tail of the striatum. First, slices of neural tissue from both male and female were collected and fixed. The researchers then tagged PV neurons and then optogenetically modified them with channelrhodopsin so that they could be optogenetically manipulated with blue light. Next, the researchers patched a SPN so that they could get an approximation for its firing rate (Fig 1A, 1B). Finally, a rectangle of illumination was patterned on to the sample using a Polygon pattern illuminator. Activity from the patched SPN was recorded during the stimulation period and regional PV activity was correlated with SPN activity.
Using CRACM, Li et al. found that SPNs in the TS responded to PV interneuron activation from a distance of up to 400 microns(Fig 1D). In the AC, while SPNs were still powerfully modulated by PV interneuron activity, PV interneurons had to be much closer to SPNs in order to exert an effect on them. PV interneurons located more than 100 microns away from a given SPN had little effect on its activity (Fig 1E).
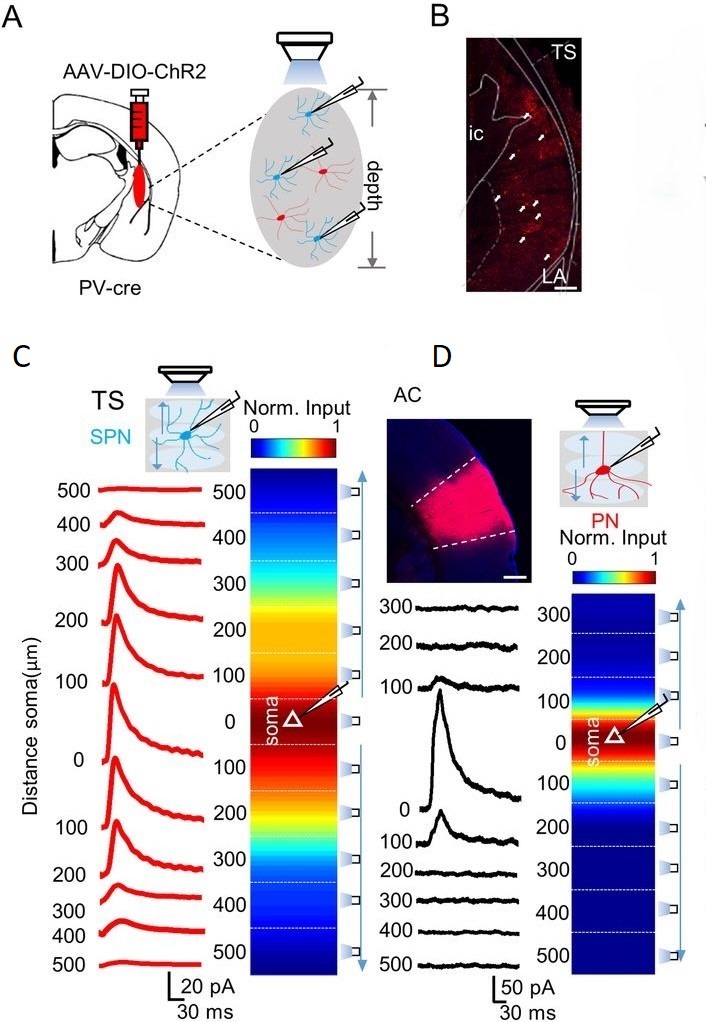
Figure 1: Innervation from PV interneurons to pyramidal neurons in TS and AC. (A) Injection of channelrhodopsin to infect PV interneurons. Fluorescent markers were used to mark SPNs to help researchers find them so that they might be patched. (B) Left, fluorescence image of labeled PV interneurons in TS. Right, example graph of the inhibitory postsynaptic currents induced in a SPN during blue light stimulation on PV interneurons. Blue arrow represents stimulation start point. (C) Schematic graph showing distance specific activation of PV interneurons in TS. Regions stimulated were 110 x 150 microns. Representative traces of activity in SPN at different distances are represented in red. (D) Schematic graph showing distance specific activation of PV interneurons in AC. Regions stimulated were 110 x 150 microns. Representative traces of activity in SPN at different distances are represented in red.
By utilizing CRACM techniques supported by the Polygon pattern illumination system, Li et al. investigated the AC and TS and their ability to process auditory information. Their results illustrate that despite the similarity in the functions of the TS and AC and the similarity of the cell types being investigated, the phenotype of SPNs and PVs in the two regions differ significantly. The size of the receptive field of SPNs within the TS is significantly larger than in the AC. This finding extends the field’s understanding of how different auditory regions in the brain process incoming signals, and how the same cell types can be expressed differently depending on what region they are found in.
If you would like to read more about the Polygon pattern illumination system and its applications you can find more details here: https://www.mightexbio.com/polygon/
Joe Banning, Applications Specialist at Mightex
To read the full publication, please click here.