of Mouse Hippocampus
Published on 2024/08/02 Research powered by Mightex’s Polygon1000 ![]()

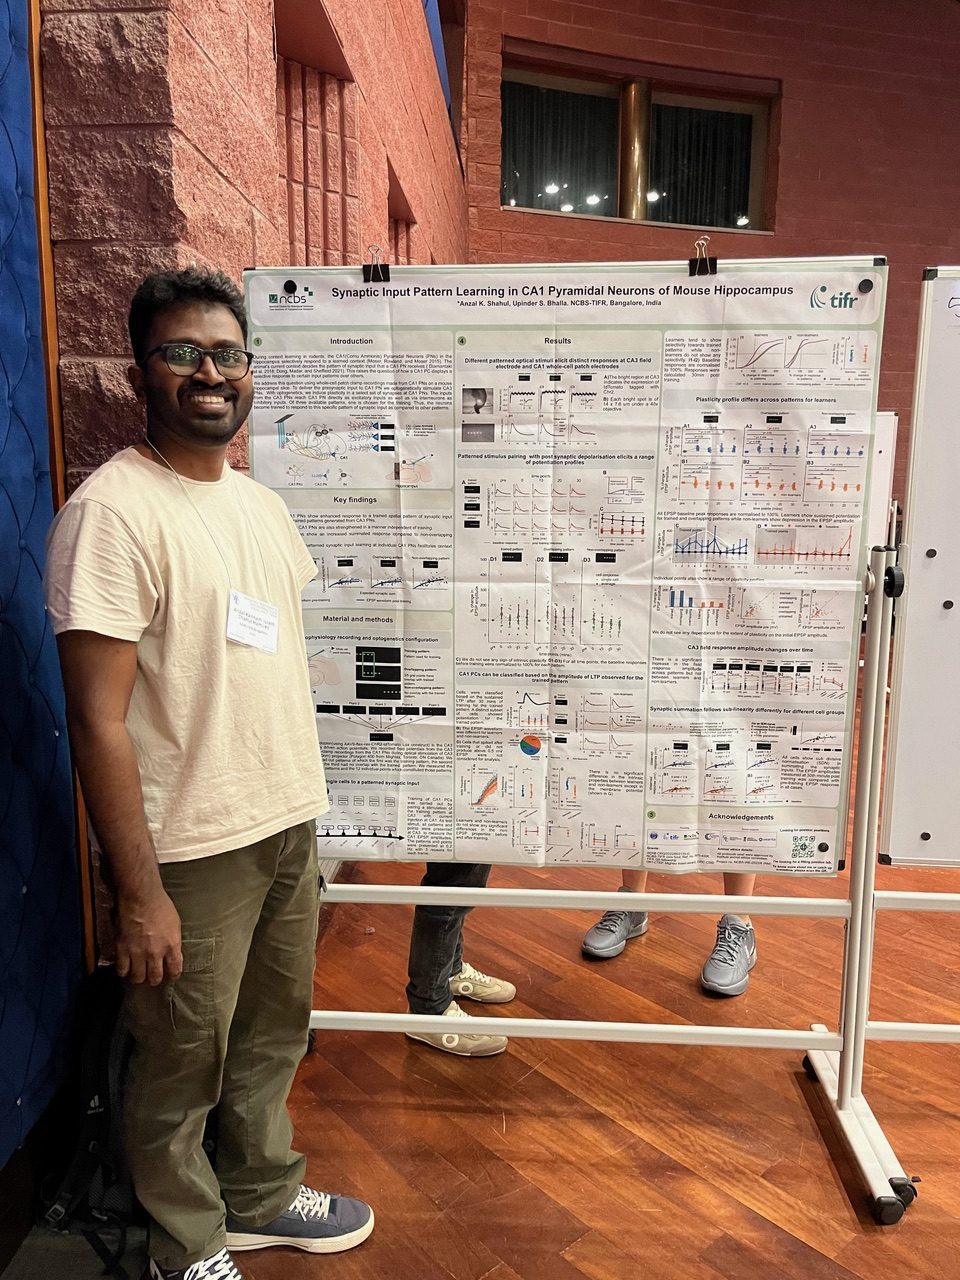
This research was recently presented by Anzal KS at the Optogenetic Approaches to Understanding Neural Circuits and Behavior (Gordon Research Conference) 2024 in Lucca (Barga), Italy and was supported by a Mightex Travel Award to promote scientific communication and sharing of research using the Mightex Polygon. Congratulations to Anzal KS! We can’t wait to see more from this exciting project!

Animals remember the context of interest. The hippocampus plays a vital role in the encoding and recollection of contextual memory in animals (Squire 1992; Tulving 1985). The pyramidal neurons (PN) in the cornu Ammonis-1 (CA1) region of the hippocampus encode context information in terms of space and time (O’Keefe 1976; Eichenbaum 2013). As the animal becomes familiar with a place, the firing frequency of CA1 PNs increases for a specific location, and such PNs are called place cells (O’Keefe 1976; Save et al. 1998; Eichenbaum 2013; Schoenenberger, O’Neill, and Csicsvari 2016). The readiness of CA1 PNs to fire is primed by a presynaptic input (Bittner et al. 2017). A place cell can be experimentally introduced for a given location by inducing spiking with depolarizing current injections in a dorsal CA1 PN while the animal is at any given location (Diamantaki et al. 2018; Ding et al. 2022). This shows strong evidence of the tunability of a place field for a given CA1 PN in the hippocampus. This project explores the mechanistic basis for the tunability of CA1 PNs.
The CA1 PNs receive both excitatory and inhibitory inputs in a precisely balanced manner (Bhatia, Moza, and Bhalla 2019). In the hippocampal microcircuit, the excitatory inputs are primarily from the entorhinal cortex (EC) and cornu Ammonis-3 (CA3) regions while the inhibitory inputs can be from CA3, CA1, or dentate gyrus regions (Pelkey et al. 2017; Booker and Vida 2018). The inhibitory neurons in turn also receive inputs from the same excitatory cells that drive CA1 neurons. If all inputs to a CA1 PN are balanced out in terms of excitation (E) and inhibition (I), how will a CA1 PN exhibit a selective firing rate increase for a learned place? One plausible mechanism to shift the balance would be to change the synaptic weight of the inputs. I address this question with the help of electrophysiology measurements made from an acute hippocampal slice preparation. We used optogenetic stimulations delivered with optical spatial patterns to CA3 PNs for eliciting synaptic inputs at CA1 PNs. The synaptic inputs received by CA1 PNs could include both excitatory and inhibitory inputs from CA3 PN stimulation. The inputs received at CA1 PNs were measured as excitatory postsynaptic potentials (EPSPs). In our study, we established a protocol to train a CA1 PN to respond to a patterned synaptic input. We found the extent of plasticity observed for the pattern used for training varies in the CA1 PN population. For all the optical stimulation experiments we used the Polygon400 (DMD projector) & BioLED Light Source Control Module from Mightex, Canada.
Figure 1. Patterned optical stimulation at CA3 forms presynaptic input patterns at CA1.Polygon was installed on the DIC microscope used for the whole cell patch recording system. For a pattern-selective neuron, post-training the EPSP amplitudes are increased and we observe a decrease in the EPSP amplitude for untrained patterns.
Key findings
Patterned optical stimulation at CA3 PNs imparts distinct levels of excitation on CA1 PN soma.
We expressed ChR2 channels on CA3 PNs specifically and performed spatially patterned stimulations on CA3 using optogenetics. The optical stimulation was strong enough to elicit measurable EPSPs at CA1 PN soma. We used a field electrode placed near the cell body layer of the CA3 region to inspect the stimulus reliability for optogenetic stimulations in all the experiments. The CA3 field recording showed distinct responses in terms of amplitude and shape of field response as a function of the input pattern. The distinct field responses at CA3 for each pattern indicate the recruitment of different CA3 PN groups. The CA1 whole-cell recording also showed a distinct amplitude response for each pattern we delivered at CA3. The distinct responses observed at CA1 PN indicate a distinct combination of synaptic input for each pattern.
CA1 PNs can be trained to respond to patterned optical inputs.
We optimized the measurement intervals between optical projections, the pulse width of the projections, the spatial arrangement of the points in a pattern, and the orientation of bright spots for eliciting distinguishable field responses at CA3. We optimized the measurement 2 intervals, number of patterns, and LTP induction protocols to see consistent LTP at CA1 PNs. Almost half of the CA1 PNs we recorded showed a selective response to the input pattern used during the paired LTP induction protocol over other patterns presented.
CA1 PNs can be classified based on the response to trained patterns.
We observed a diverse range of plasticity levels for different cells we recorded from. We could not find any physiological difference between the cells that showed pattern selectivity and those that did not. We made sure the recordings were done from CA1 PNs with similar cell body shapes and from the same location in the slice to reduce the variability due to connectivity in the slice. We also didn’t see any distinction in terms of their intrinsic properties. Based on the response of those cells to the trained pattern we classify them into pattern-selective and pattern-non-selective cells.
Non-overlapping patterns do not show sustained potentiation in pattern-selective cells and show non-selectivity to non-overlapping pattern
We presented three distinct patterns at CA3 and measured the level of plasticity observed for each pattern after the LTP induction protocol(training). The first pattern presented was used for training. The second pattern had a 66% spatial overlap with the trained pattern and the third pattern had no spatial overlap with the trained pattern. We measured the EPSP amplitude before and up to 30 minutes after training for each pattern in multiple trials. The trained patterns show an increase in the EPSP amplitude in half of the recorded cells. We observed that the pattern-selective cells show a sustained LTP for the trained and overlapping pattern but not for the non-overlapping pattern. On top of that, they also do not show any selectivity to the non-overlapping pattern.
All patterns show increased inhibition post-training for all cell groups.
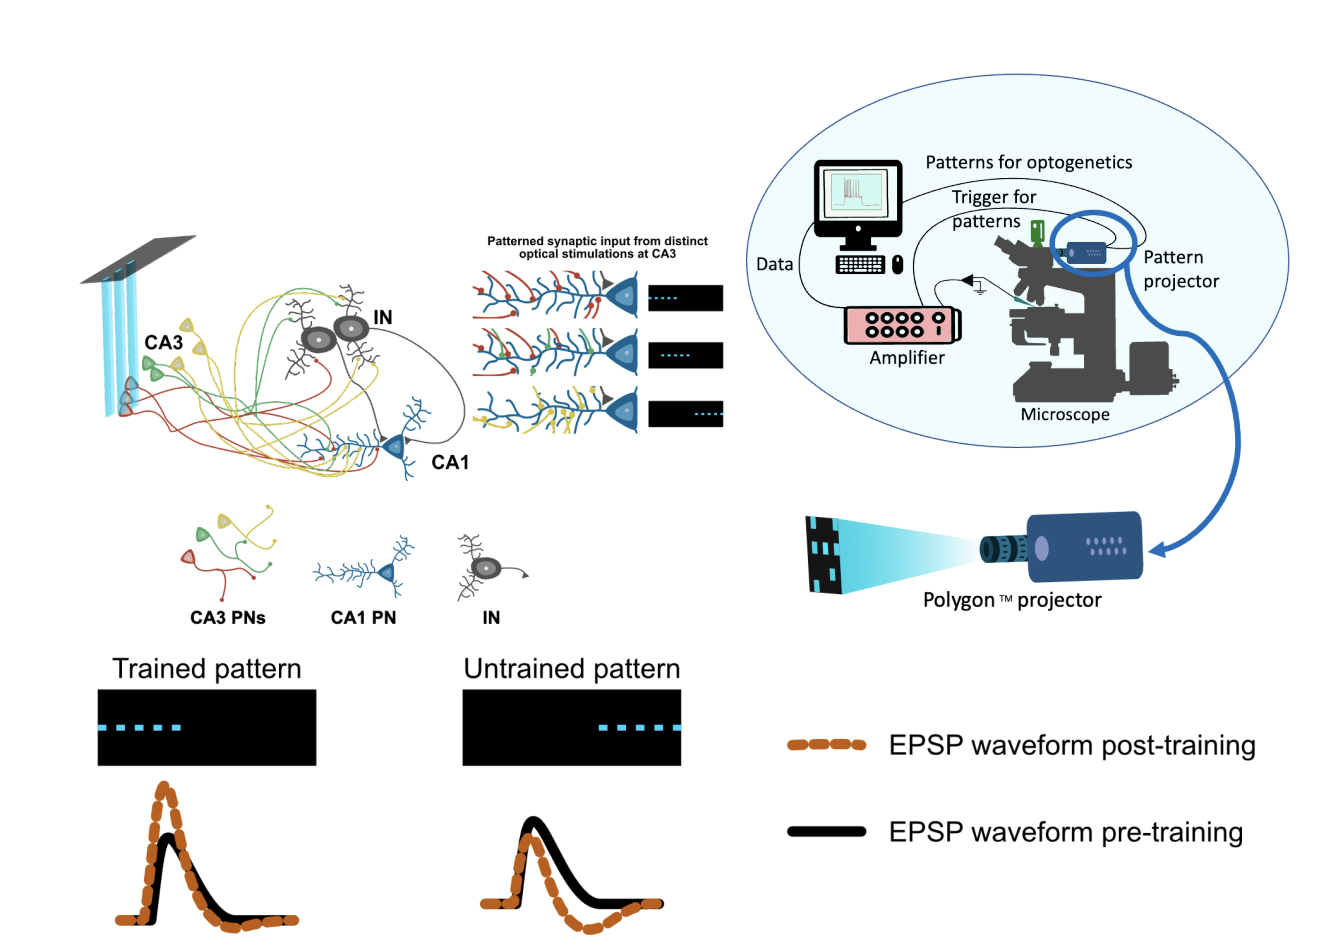
Figure 2. The schematic shows the change in waveform shape of EPSP before and after training. The EPSP we observe is a summated waveform of E and I inputs.
For most cells we recorded, we observed a specific waveform shape change post-LTP induction for the EPSPs. The shape observed goes in hand with the summated effect of an
excitatory and inhibitory potential coming at different timings as shown in Fig 2. The magnitude of the dip is prominently observed in post-LTP induction and common to all cells.
Role of intrinsic plasticity in the increased dip of the EPSP amplitudes post rise/peak
We validated that the dip we observed was not due to the recruitment of HCN channels during the plasticity induction protocol. We performed a sag analysis for all the cells before and after training, to validate the role of HCN channels. With no significant change in intrinsic plasticity levels, the observed dips in the EPSP waveforms and the EPSP amplitude increase are likely from plasticity at the synapse level.
CA3 PC population does not show any signs of plasticity
We validated that the plasticity we observed at CA1 PNs is not due to variation at the stimulus delivery location. We analyzed the field response timing and shape. We performed this analysis for all cell groups and time points of plasticity measurement. The analysis results indicate the plasticity could not be at the stimulus delivery level since the spike amplitude or timing of CA3 has not changed.
CA1 neurons preserve the synaptic spatial input computation.
To check the computational nature of CA1 PNs for different patterned synaptic inputs, we checked how the subsets of synaptic inputs are summated, at the soma. We used the data from individual bright spots that made a pattern and compared the summated value obtained upon presenting a pattern. We performed this analysis on different cell groups and time points for comparison. We do not see any difference in the summation property of a given neuron before and after training for all patterns.
Author: Anzal KS
Bio: Graduate student at the National Centre for Biological Sciences (NCBS-TIFR), Bangalore, India.